BigQuery: An interactive analytics benchmark
If you have operational data sitting in BigQuery that powers dashboards through tools like Tableau, Looker, or Apache Superset, putting an exploratory analytics tool on top of your BigQuery datasets can enable business and technical users to interact with the data in an interactive, exploratory fashion, and performance is surprisingly good. Using a standard dataset of varying sizes, an automated test suite ran over the data simulating “slice and dice” with concurrent users and performance of BigQuery was measured.
Test methodology
The benchmark tests used the Star Schema Benchmark dataset, which has been in use for over a decade to assess data warehouse performance. Three datasets were created consisting of different row counts, from 100 million rows to 1.2 billion rows. The datasets were generated with an appropriate scale factor to reach the target data volume over a one month time period and loaded into BigQuery. In BigQuery, the line order, customer, supplier, and part tables were denormalized into one flattened table. Interactive analytics is typically done on de-normalized, wide datasets with all facts and dimensions residing in one table.
After loading the data, up to five users simultaneously asking “aggregate over time” and “topN” queries over a one week timeframe for 12 minutes was simulated. To minimize effects of caching by BigQuery, the columns selected by each query along with the time ranges filtered on were varied. This behavior mimicked here is the common user behavior when performing “slice and dice” type analytics.
3 tests in total were run. The query response times presented below are direct from BigQuery and exclude a small number of cached queries for each run.
The findings
- The tests show that BigQuery provides response times suitable for exploring high volume, high dimensionality, time series data in an interactive fashion with five concurrent users running “slice and dice” type queries. The figures below show the median and 99th percentile response times and BigQuery slots consumed for each test we conducted.
- For 50% of all queries executed, the response time was under 2 seconds for a moderately sized table with 100 million events per month and under 4 seconds for a table with 1.2 billion events per month.
- The 99th percentile response times, a measure of worst case performance, were slightly over 8 seconds in all our tests and over 10 seconds in one of our tests.
- As the dataset size increases, BigQuery intelligently parallelized query execution across more slots in its serverless compute environment to return results in a reasonable time period. For example, looking at Figure 1 below, BigQuery consumed 11 slots in the median case for each query in the 100M Row / 40 GB dataset, and in the 300M Row / 117 GB dataset, it used 31 slots in the median case.
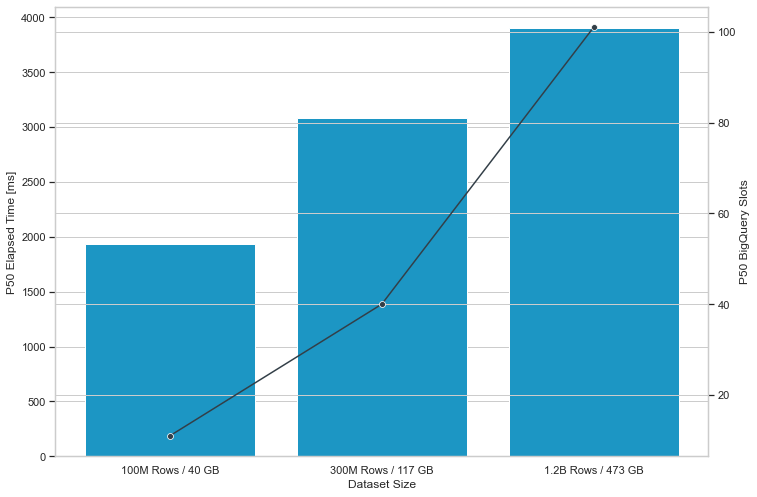
Figure 1: Median response times of 3 benchmark tests conducted on one month of the Star Schema Benchmark dataset where the number of table rows was 100 million, 300 million, and 1.2 billion and the BigQuery on-demand pricing model was used.
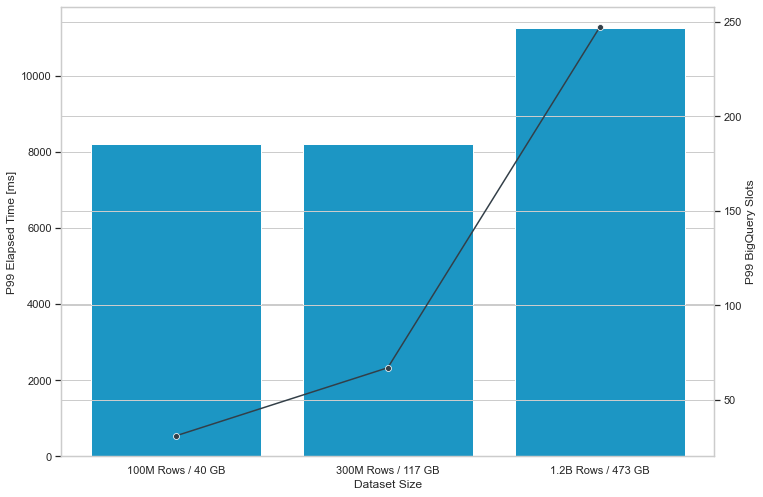
Figure 2: 99th percentile response times of 3 benchmark tests conducted on one month of the Star Schema Benchmark dataset where the number of table rows was 100 million, 300 million, and 1.2 billion and the BigQuery on-demand pricing model was used.
[1] This post of mine originally appeared on the Facet blog. What you see above is a condensed version.