Snowflake supports interactive analytics at scale
With a proliferation of massively parallel processing (MPP) database technologies, like Apache Pinot, Apache Druid, and ClickHouse, there are no shortage of blog posts on the Internet explaining how these technologies are the only ones capable of supporting interactive analytics on large data volumes. That is not the case. Benchmark tests on Snowflake’s platform with wide, denormalized datasets and concurrent query access patterns show that Snowflake offers reasonably fast query performance on large datasets when queried in an iterative, ad-hoc fashion.
Test methodology
The benchmark tests used the Star Schema Benchmark dataset, which has been in use for over a decade to assess data warehouse performance. Four datasets were created consisting of different row counts, from 100 million rows to 1.2 billion rows. The datasets were generated with an appropriate scale factor to reach the target data volume over a one month time period and loaded into Snowflake. In Snowflake, the line order, customer, supplier, and part tables were denormalized into one flattened table. Interactive analytics is typically done on de-normalized, wide datasets with all facts and dimensions residing in one table.
After loading the data, up to five users simultaneously asking “aggregate over time” and “topN” queries over a one week timeframe for 12 minutes was simulated. To minimize effects of caching by Snowflake, the columns selected by each query along with the time ranges filtered on were varied. This behavior mimicked here is the common user behavior when performing “slice and dice” type analytics.
12 tests in total were run–three for each dataset with a different Snowflake warehouse size (medium, large, and x-large). Snowflake has smaller and larger warehouses. It’s recommend to start with a smaller warehouse and increase the warehouse size based on your data volume, expected usage, and budget.
The query response times presented below are direct from Snowflake and exclude a small number of cached queries for each run.
The findings
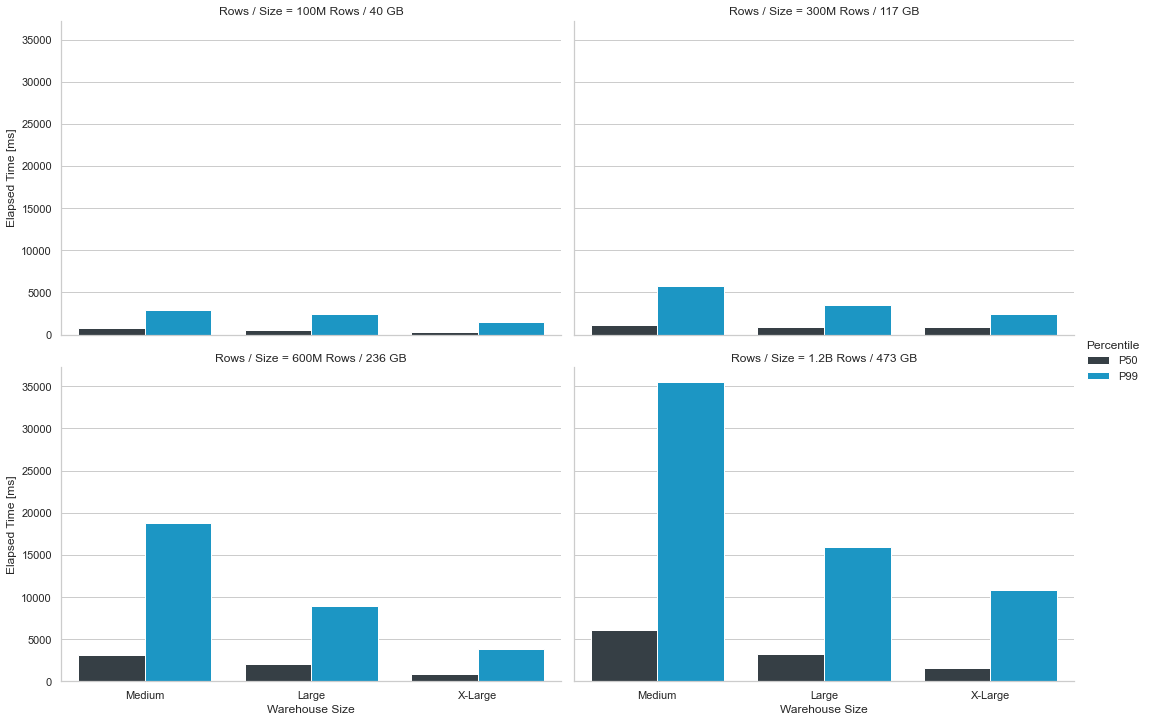
The tests show that Snowflake provides response times suitable for exploring high volume, high dimensionality, time series data in an interactive fashion with five concurrent users running “slice and dice” type queries. The figure below shows the median and 99th percentile response times for each test conducted.
- As the dataset size increases, the query response times increase.
- As more compute power is applied, the query response times improve.
- The median response time for all tests we ran is 3 or fewer seconds (with the exception of the 1.2B row dataset on the medium warehouse).
- In some cases, queries did return in under one second.
- The 99th percentile is used extensively in performance testing to provide a measure of worst case performance. In over half the tests ran, the worst case was approximately five seconds or better.
- No queueing of individual queries or warehouse cluster scaling was observed during the tests, so there is room for additional concurrent usage.

Figure 1: Results of 12 benchmark tests conducted on one month of the Star Schema Benchmark dataset where the number of table rows was 100 million, 300 million, 600 million, and 1.2 billion and the Snowflake warehouse size varied with each test.
Configuring Snowflake for optimal query results was actually quite easy. To avoid scanning entire tables in Snowflake, tables were clustered by timestamp. Clustering is available out of the box with Snowflake and happens automatically once the table is created. For these tests, a timestamp is used for a filter in every query and clustering provided a nice benefit. In real-world applications, you might even observe better performance for queries that are frequently run due to Snowflake’s result cache in their service layer and the local disk cache in their compute layer. The tests minimized the effect of caching; the small number of cached queries exercised in the tests were removed from the results. For more information, refer to Caching in Snowflake Data Warehouse.
[1] This post of mine originally appeared on the Facet blog. What you see above is a condensed version.